The following FDS guide will teach you how to run your first FDS simulation.
This guide walks you through the complete setup of a simple FDS simulation, from an empty input file to the analysis of basic outputs.
The goal is to show the full workflow, not to cover all modeling choices or validation aspects.
1. Introduction
This video shows the results of the Fire Dynamics Simulator job you are about to execute:
This Fire Dynamics Simulator tutorial is about the basic functions of the program. If you are an experienced user this guide will constitute a useful recap.
The aim of the FDS simulation we are about to create is to measure the air temperature near the ceiling during a room fire.
Input data:
- Room dimensions: 3 x 4 x 3 m
- Door dimensions: 1 x 2 m
- Window dimensions: 1 x 1 m
- Burning object location: middle of the room
- Heat release rate: 750 kW
Note for beginners
If you prefer a single, structured learning path that guides you step by step through FDS fundamentals and core concepts, you may want to check the FDS Fundamentals Course.
2. Creation of the input file – FDS simulation
An FDS simulation is defined by a single text-based input file with the .fds extension.
Create a new text file in an empty folder and rename it to:
job1.fds
Make sure the file extension is .fds, not .txt.
2.1. Setting up the file structure
Open the .fds file with a text editor.
Every FDS input file starts with a header and ends with a tail:
&HEAD CHID='job1', TITLE='job1' /

&TAIL /
All simulation parameters will be written between these two lines.
At this stage, no additional settings are required.
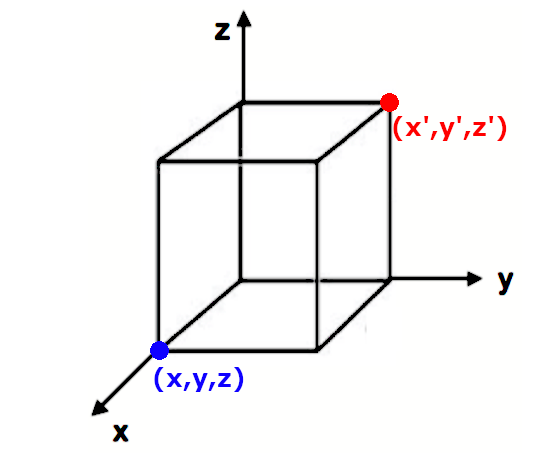
2.2. Setting the computational domain
Define the computational domain using a single mesh.
For this example, the domain size is 3 × 4 × 3 m, discretized with 0.1 m cells.
&MESH XB= 0, 3, 0, 4, 0, 3, IJK= 30, 40, 30 /
XBdefines the domain limits in metersIJKdefines the number of cells along each direction
At this stage, the mesh is chosen only to keep the example simple.
Note for beginners
In this example, the mesh size is chosen for simplicity.
In real applications, mesh selection directly affects accuracy, stability and computation time.
Mesh sensitivity, resolution criteria and practical trade-offs are covered in detail in the FDS Fundamentals Course.
2.3. Setting up the duration of the FDS simulation
Set the simulation duration to 60 seconds:
&TIME T_END=60. /
Add the following line to control output frequency:
&DUMP NFRAMES=60 /
This produces one output frame per second.
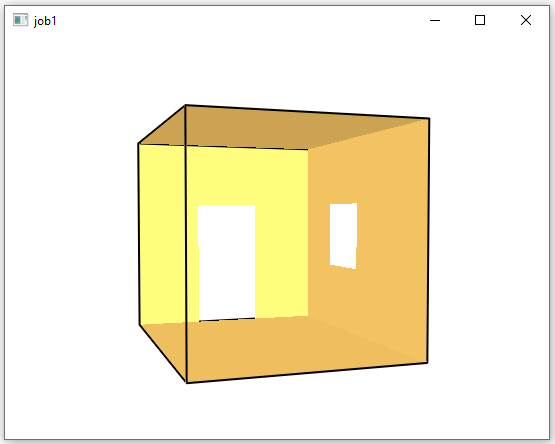
2.4. Modelling the openings
Model the room openings using &VENT:
&VENT XB= 1, 2, 4, 4, 0, 2, SURF_ID='OPEN' / door
&VENT XB= 3, 3, 2, 3, 1, 2, SURF_ID='OPEN' / window
XBdefines the opening geometrySURF_ID='OPEN'represents a passive opening to the outside
You can now save the file and run the simulation for a few seconds to visually verify the geometry in Smokeview.
For detailed instructions on how to run an FDS job on Windows, see this guide.
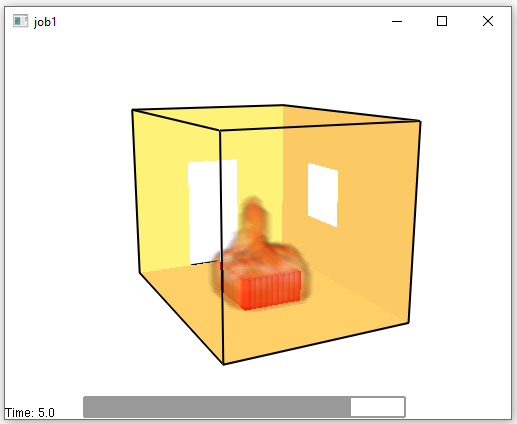
2.5. Modelling the combustion
Define the fire by assigning a burning surface to an obstruction.
First, specify the fuel used in the simulation:
&REAC FUEL = 'PROPANE'
Create the burning object using an obstruction:
&OBST XB= 1, 2, 1.5, 2.5, 0, 0.5, COLOR='RED', SURF_ID='fire1' /
Then define the surface applied to the obstruction:
&SURF ID='fire1', HRRPUA=250 /
At this stage:
- the obstruction defines the fire geometry
- the surface defines the fire intensity
The chosen parameters are only intended to produce a simple, stable fire for this example.
Note for beginners
Selecting HRR values based on real fire scenarios, test data or standards
requires additional assumptions and verification.
This aspect is addressed step by step in the FDS Fundamentals Course.
If we run the simulation and then open the Smokeview file, we can see the fire animation by loading the HRRPUV parameter:
2.6. Outputs selection
At this point, the fire has been defined but no meaningful data is being extracted yet.
In this example, we will only monitor the air temperature near the ceiling, using two basic output types:
- a point measurement (numeric output over time)
- a plane visualization (qualitative distribution)
Device output line:
&DEVC ID='T air 1', XYZ=1, 2, 2.8, QUANTITY='TEMPERATURE' /
This will generate a .csv file containing temperature values over time at the specified point.
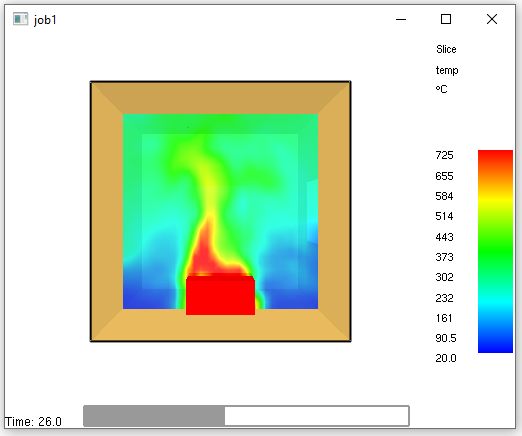
Slice file output line:
Add a slice file to visualize temperature on a vertical plane:
&SLCF PBY = 2, QUANTITY='TEMPERATURE'/
This output will be displayed in Smokeview as a color-mapped temperature field.
The FDS input file is now complete.
You can download the full .fds input file below and execute it to review the results in Smokeview and in the generated CSV output.
3. Outputs review
This section shows where the main output files generated by FDS are located and how to open them.
At this stage, outputs are used only to verify that the simulation has been set up and executed correctly.
No detailed interpretation or validation is performed.
After completing the input file, run the simulation and let it finish.
Running the job will produce several output files in the same folder as the input file.
The two most relevant files for this tutorial are:
job1.smvjob1_devc.csv
3.1. The “.smv” file
Open the .smv file with Smokeview to visualize the simulation results.
To load outputs in Smokeview:
Right click → Load/Unload
From this menu you can load:
- outputs generated automatically by FDS (e.g. fire-related visualizations)
- outputs explicitly defined in the
.fdsinput file (such as slices or devices)
Loaded outputs are displayed as animations and can be started, paused, or unloaded using the same menu or basic keyboard controls.
3.2. The “_devc.csv” file
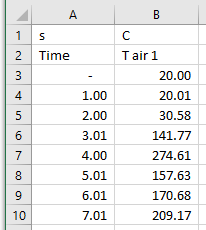
The _devc.csv file contains the numerical output requested with the &DEVC line.
Open the file with any spreadsheet software to view the temperature values over time at the selected location.
Note for beginners
If you prefer a single, structured learning path that guides you step by step through FDS fundamentals and core concepts, you may want to check the FDS Fundamentals Course.
4. Where to run the simulation
You might want to start your simulation directly onto your PC at first, but FDS simulation can require hours and even days to compute.
In the future, once you will start making large and more complex situation you might want to start to run your simulations on a Cloud Computing service.
FDS guides and examples
For more guides and tutorials, check out the complete FDS guides and FDS example.