The following presents an example of mesh sensitivity analysis for an office fire scenario, aiming to evaluate how mesh resolution affects simulation results.
Key Inputs:
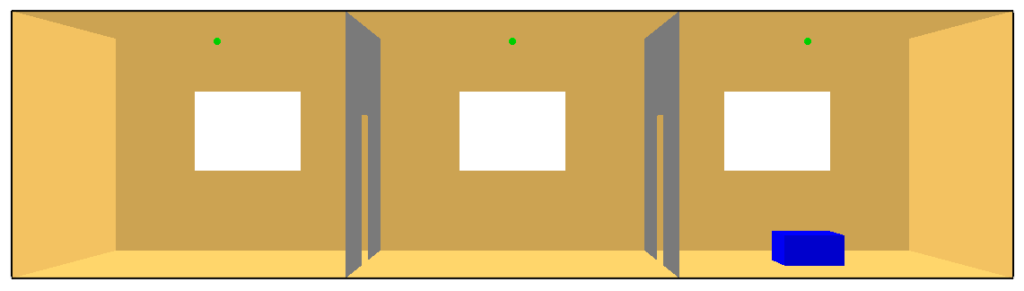
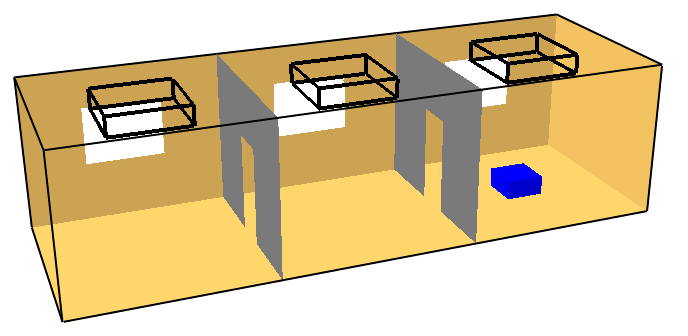
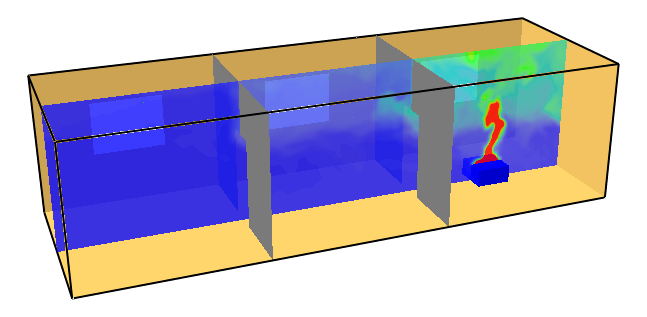
- Geometry: 3 office rooms, each 4 × 4 m, connected by doors
- Openings: Windows on one side of each room
- Heat Release Rate (HRR): Curve calculated according to Eurocode guidelines (see full guide on determining the HRR curve using Eurocode or US/NFPA/SFPE methodologies)
- Analysis Method: Mesh sensitivity study following the methodology described in the referenced article
Characteristic Fire Diameter and Initial Mesh Selection
Before running the simulations, the Characteristic Fire Diameter (D*) is calculated. This parameter provides a guideline for selecting an appropriate initial mesh size. Using the maximum HRR of the simulation (approximately 1000 kW), the characteristic fire diameter is:
- Characteristic Fire Diameter (D*) = 0.959 m
Based on this, initial coarse, medium, and fine mesh sizes can be estimated using the ratio D\*/dxD\*/dxD\*/dx, where dxdxdx is the cell size.
| Mesh Type | D*/dx | Cell Size (dx) | Number of Cells (I, J, K) | Example MESH Line |
| Coarse | 4 | 0.240 m | 126, 42, 34 | &MESH IJK=126,42,34, XB=0,30,0,10,0,8 / |
| Medium | 10 | 0.096 m | 313, 105, 84 | &MESH IJK=313,105,84, XB=0,30,0,10,0,8 / |
| Fine | 16 | 0.060 m | 501, 167, 134 | &MESH IJK=501,167,134, XB=0,30,0,10,0,8 / |
These values provide an initial estimate. A proper mesh sensitivity analysis requires running simulations with progressively finer meshes until the results converge, meaning further refinement does not significantly increase accuracy.
Convergence study
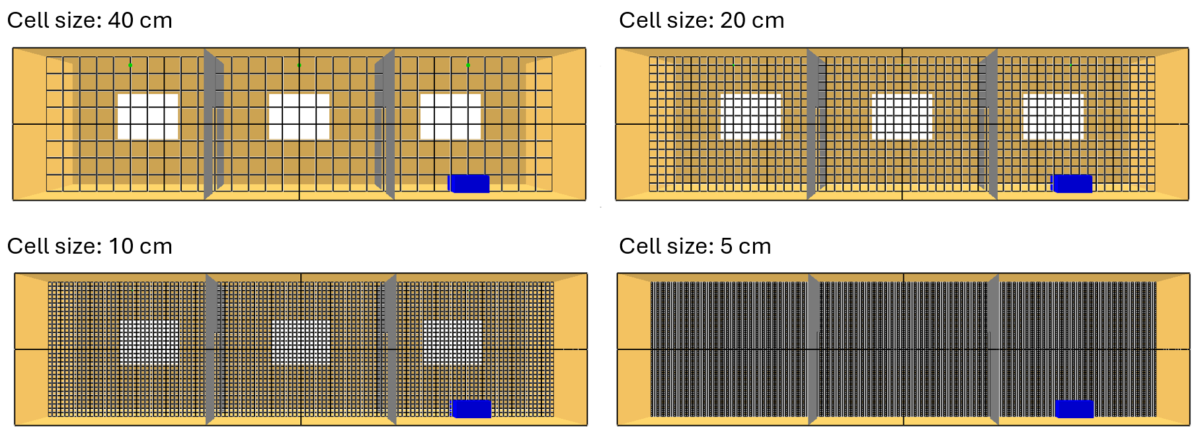
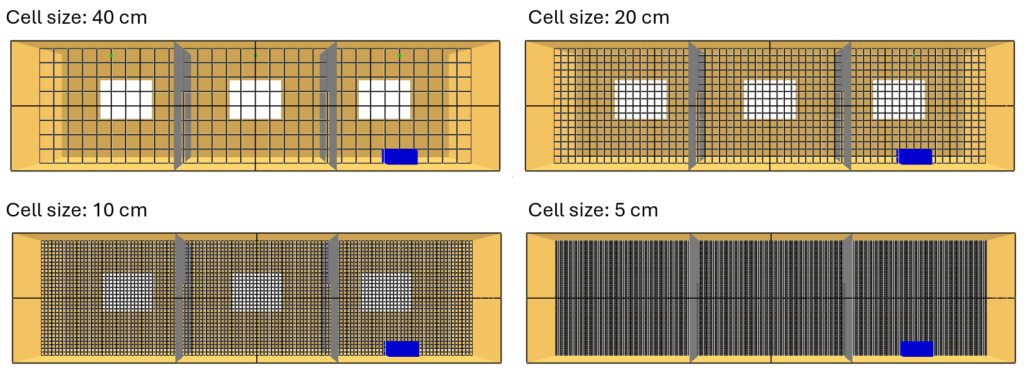
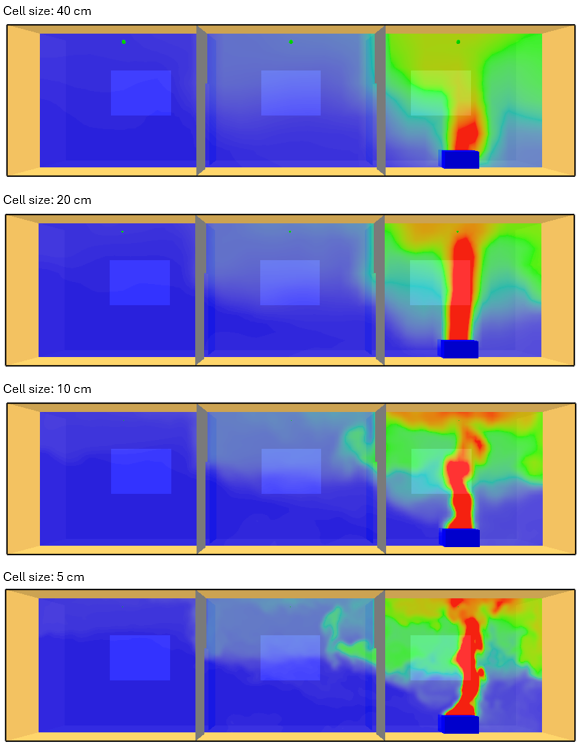
In this example, simulations were performed with cell sizes of 0.4 m, 0.2 m, 0.1 m, and 0.05 m. Note that these last three values correspond approximately to the coarse, medium, and fine meshes derived from D*, obtained by halving the cell size at each step.
The quality of the mesh approximation was assessed in two ways:
1. Devices
Temperature and soot density devices were placed in all three rooms. These devices do not measure a single point; rather, they record the average values over a defined volume. This averaging smooths the measurement curves and reduces errors caused by small, localized flows, which could otherwise produce misleading spikes in point measurements.
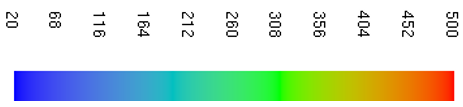
2. Slice Files
Slice files were used to record temperature and visibility distributions throughout the rooms, providing a spatial view of the fire dynamics and supporting the assessment of mesh refinement effects.
Results
Note: Room 3 is the fire room, while Room 1 is the room farthest from the fire source.
Temperature
Temperature was evaluated using both volumetric devices and slice files.
From the device data, temperature results are largely consistent across all mesh resolutions. The differences between coarse and fine meshes are limited, and no significant discrepancies are observed in the overall temperature levels in any of the rooms. This behavior is expected, as the devices measure volume-averaged quantities rather than point values. As a result, the measured temperature curves are smooth by construction and are not affected by local small-scale fluctuations or numerical noise.
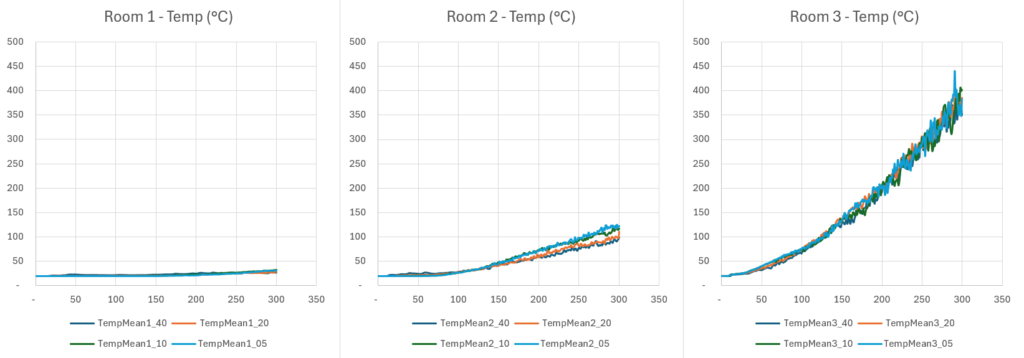
Although differences are generally small, the simulations with 10 cm and 5 cm cell sizes show very similar numerical values and trends, while the coarser meshes exhibit slightly larger deviations. These deviations remain limited and do not change the qualitative interpretation of the results.
The slice files provide a complementary, spatially resolved view of the temperature field. As mesh resolution increases, the temperature distribution does not become smoother; instead, it becomes better resolved. Finer meshes allow sharper gradients and clearer separation between hot and cooler regions, resulting in higher contrast and improved visualization of the temperature field. Despite these visual differences, the absolute temperature levels observed in the slices remain consistent with the device measurements and do not indicate major changes between mesh resolutions.
Overall, temperature results show a low sensitivity to mesh resolution for this scenario. The similarity between the 10 cm and 5 cm cases, together with the limited differences observed in coarser meshes, suggests that temperature predictions are already sufficiently resolved at a 10 cm cell size.
Soot Density
Soot density shows a stronger dependence on mesh resolution compared to temperature.
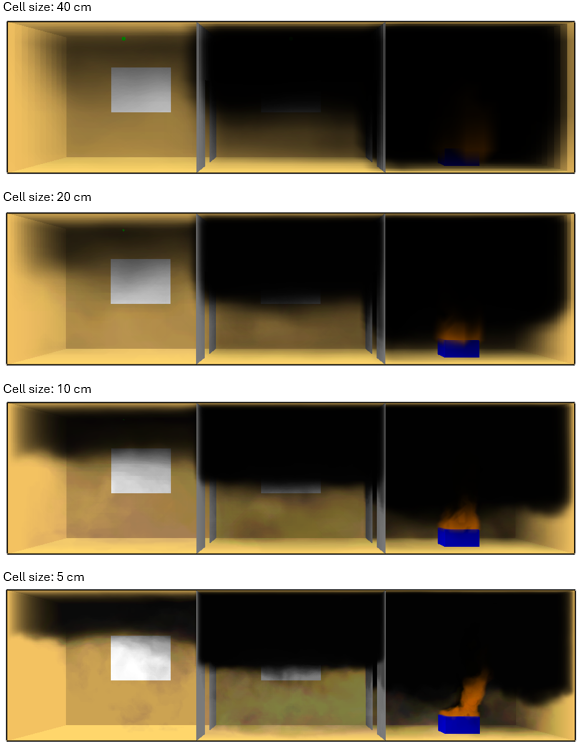
Both device outputs and slice files highlight noticeable differences between the various mesh sizes. In the fire room (Room 3), soot density values are relatively similar across resolutions. In contrast, in Rooms 1 and 2, increasing mesh resolution leads to higher predicted soot densities.
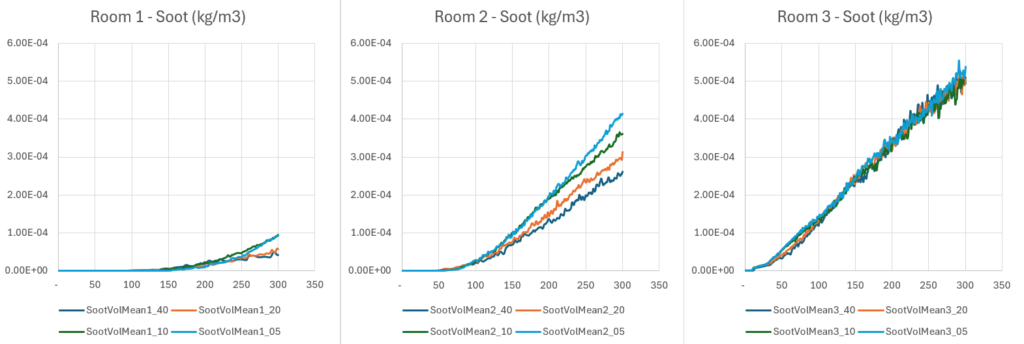
This trend indicates that coarser meshes tend to underpredict soot transport into the rooms further away from the fire source. As the resolution increases, smoke movement and accumulation are captured more effectively, resulting in higher soot density values. While the 10 cm and 5 cm meshes show closer agreement than the coarser cases, some differences are still present, indicating that soot-related quantities converge more slowly than temperature.
Evaluation
Additional quantities, such as visibility, or slice files along different planes, could be analyzed depending on the objectives of the study.
For the purposes of this example, the analysis is limited to temperature and soot density. Based on the observed results, a 10 cm mesh size represents a reasonable compromise between computational cost and accuracy. At this resolution, temperature results are stable and consistent, while soot density is captured with acceptable accuracy for engineering applications.