The Heat Release Rate (HRR) is the single most important variable in fire hazard analysis. It serves as the primary driver for all quantifiable fire effects, including compartment temperatures, smoke transport, and the activation of fire protection systems.
This article explains how to calculate the Heat Release Rate (HRR) curve, a key variable in fire analysis. The content is organized into the following sections:
- Introduction to HRR: what it is and why it is important in fire safety.
- Standardized Design Fire Curves: overview of the different phases of a fire.
- Calculation Methods:
- Eurocode method (EU standard) – formulas and examples according to European standards.
- NFPA method (US standard) – formulas and examples according to US standards.
- Comparison and Key Takeaways: highlighting the main differences and practical considerations for each method.
Each section is structured to guide you step by step, from understanding the theory to applying it in calculations.
Table of Contents
The Standardized Design Fire Curve
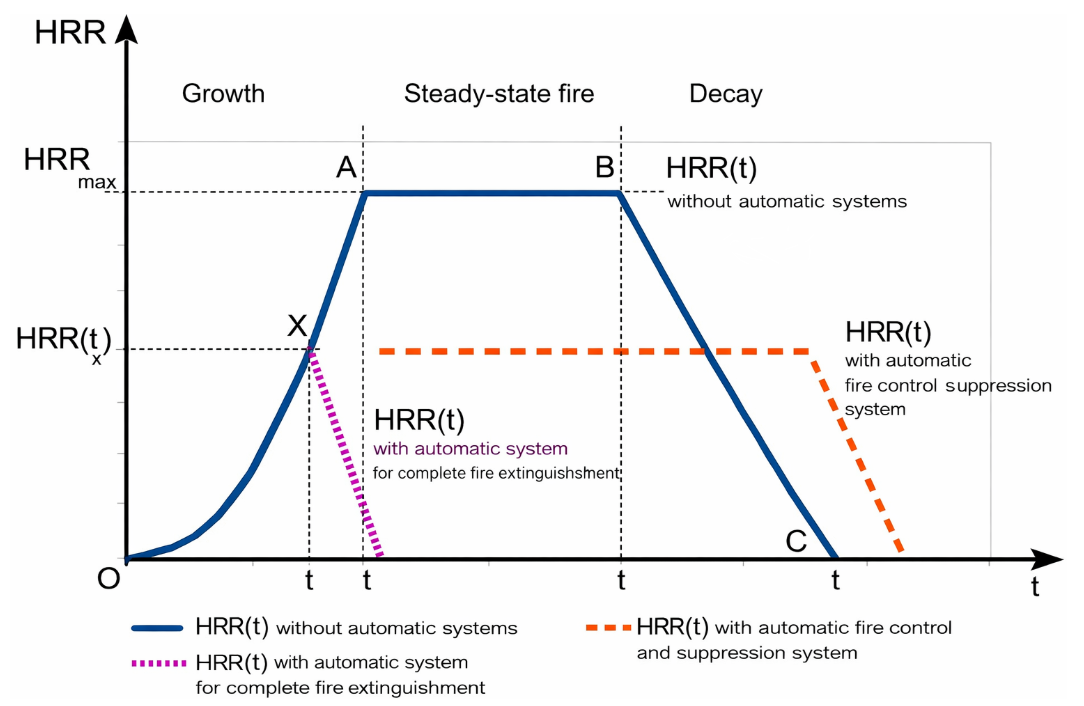
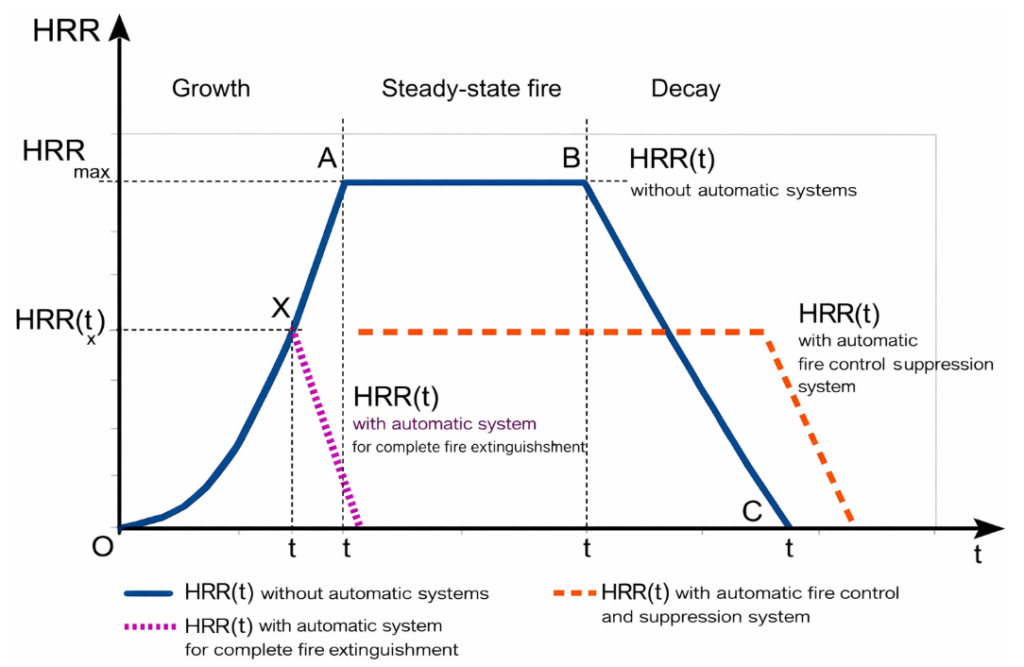
A “Design Fire” is a quantitative temporal description of assumed fire characteristics. It idealizes the fire into four distinct phases:
- Incipient Phase: A period of smoldering or low intensity. In deterministic FDS models, this is often represented as a time offset \(t_0\).
- Growth Phase: Typically modeled using a power-law relationship, most commonly the \(t^2\) (time-squared) model.
- Stationary (Peak) Phase: The period of maximum energy release, limited by fuel or ventilation.
- Decay Phase: The stage where the HRR declines as fuel is consumed.
Methodology 1: Eurocode Approach (EN 1991-1-2)
The calculation of the HRR curve according to EN 1991-1-2 Annex E follows a deterministic development characterized by four stages: incipient, growth, stationary (peak), and decay.
1. Fire Load and Design Values
Before defining the curve, the design fire load density (\(q_{f,d}\))must be calculated to determine the total energy available: $$q_{f,d} = q_{f,k} \cdot m \cdot \delta_{q1} \cdot \delta_{q2} \cdot \delta_n \quad [MJ/m^2]$$
- \(q_{f,k}\): Characteristic fire load density per unit floor area.
- \(m\): Combustion factor (0.8 for wood-based materials, 1.0 for others).
- \(\delta_{q1}, \delta_{q2}\): Factors accounting for compartment size and occupancy risk.
- \(\delta_n\): Factor for active fire protection measures (e.g., sprinklers, smoke detection).
| Occupancy Type | \(q_{f,k}\) (80% fractile) [MJ/m²] | Fire Growth Rate (\(t_\alpha\)) |
|---|---|---|
| Offices | 511 | Medium |
| Dwellings | 948 | Fast |
| Schools | 350 | Medium |
| Shopping Centers | 750 | Fast |
| Libraries | 1824 | Slow |
2. Growth Phase
The fire growth is represented by the \(t^2\) fire equation: $$\dot{Q}(t) = 1000 \cdot \left( \frac{t}{t_\alpha} \right)^2 \quad [kW]$$ Where \(t_\alpha\) is the time needed to reach a heat release of 1000 kW.
| Growth Category | \(t_\alpha\) [s] | Growth Coefficient \(\alpha\) (\(kW/s^2\)) |
|---|---|---|
| Slow | 600 | 0.00293 |
| Medium | 300 | 0.01172 |
| Fast | 150 | 0.04690 |
| Ultra-Fast | 75 | 0.18760 |
3. Peak Heat Release Rate (\(HRR_{max}\))
The maximum HRR is the lower of the fuel-controlled and ventilation-controlled limits.
- Fuel-Controlled: \(\dot{Q}_{max, f} = HRR_f \cdot A_f\).
- \(HRR_f\): Maximum HRR per unit floor area (e.g., 250 \(kW/m^2\) for offices, 500 \(kW/m^2\) for shopping centers).
- \(A_f\): Floor area effectively occupied by the fire load.
- Ventilation-Controlled: \(\dot{Q}_{max, v} = 0.10 \cdot m \cdot H_u \cdot A_v \cdot \sqrt{h_{eq}}\).
- \(H_u\): Calorific value of wood (17.5 MJ/kg).
- \(A_v\): Area of openings (\(m^2\)).
- \(h_{eq}\): Equivalent height of openings [m].
4. Transition and Decay Phase
The stationary phase lasts until 70% of the total fire load energy (\(E_{total} = q_f \cdot A_f\)) is consumed.
- \(t_{max}\) (Time to reach peak): \(t_{max} = \sqrt{HRR_{max} \cdot t_\alpha^2 / 1000}\).
- \(t_{decay}\) (Start of decay): \(t_{decay} = t_{max} + \frac{0.7 \cdot E_{total} – E_{growth}}{HRR_{max}}\).
- \(t_{tot}\) (Total burnout): \(t_{tot} = t_{decay} + \frac{2 \cdot 0.3 \cdot E_{total}}{HRR_{max}}\).
The decay is linear: \(\dot{Q}(t) = HRR_{max} \cdot \frac{t_{tot} – t}{t_{tot} – t_{decay}}\).
Methodology 2: US/NFPA and SFPE Approach
The US methodology, often derived from NFPA 92 and the SFPE Handbook, relies heavily on experimental data for specific fuel packages and the Kawagoe Law for ventilation limits.
1. Characterizing the Growth Phase
Similar to the Eurocode, the US standard uses the \(t^2\) fire model: $$\dot{Q} = \alpha \cdot t^2 \quad [kW]$$ The growth coefficient \(\alpha\) is selected based on the occupancy or specific items.
| Fuel Package Example | Growth Rate | \(\alpha\) (\(kW/s^2\)) |
|---|---|---|
| Wood flooring, rolled paper | Slow | 0.003 |
| Typical office furniture | Medium | 0.012 |
| Upholstered sofas | Fast | 0.047 |
| Plastic crates (high-stacked) | Ultra-Fast | 0.188 |
2. Estimating Peak HRR via HRRPUA
The peak is often determined by the Heat Release Rate Per Unit Area (HRRPUA) of the fuel: $$\dot{Q}_{peak} = \dot{q}” \cdot A_{fire} \quad [kW]$$
- \(\dot{q}”\): Design HRRPUA (\(kW/m^2\)).
- \(A_{fire}\): Projected area of fire involvement.
| Occupancy | HRRPUA Range [kW/m²] |
|---|---|
| Offices | 150 – 650 |
| Shops | 270 – 1200 |
| Hotel Rooms | 250 (average) |
| Residential | 320 – 570 |
| Industrial | 90 – 620 |
3. Ventilation Limits (Kawagoe’s Law)
In the US, the post-flashover ventilation limit is traditionally calculated as: $$\dot{Q}_{max, v} = 1500 \cdot A_o \cdot \sqrt{H_o} \quad [kW]$$ Where \(A_o\) is the opening area and \(H_o\) is the opening height. This assumes a constant heat release of ~3.0 MJ per kg of air consumed.
4. Total Energy and Decay (Energy Conservation Method)
Based on NUREG/CR-6850 and SFPE principles, the curve is adjusted to preserve the Total Energy Released (TER).
- Total Energy (\(E_{total}\)): Calculated from the mass of fuel multiplied by the effective heat of combustion (\(\Delta H_{c,eff}\)).
- Example: Wood ≈ 17.5 \(\text{ MJ/kg}\); Plastics ≈ 25–30 \(\text{ MJ/kg}\).
- Growth Energy (\(E_{growth}\)): \(\frac{1}{3} \cdot \dot{Q}_{max} \cdot t_{max}\).
- Steady State Duration (\(t_{steady}\)): Assumes 70% of energy is released by the end of the peak phase.
- Decay Phase: A common conservative rule is that the decay duration is double the peak duration (\(t_{decay} = 2 \cdot t_{peak}\)), or calculated by the remaining 30% of energy using a linear ramp.
Summary of Key Differences
- Eurocode is more formalized in its use of \(\delta\) safety factors to modify the fire load density.
- US/NFPA methodology relies more on item-specific HRRPUA values and empirical testing data (e.g., NIST data) for representative fuel packages like trash cans or furniture.
- Ventilation limit constants differ slightly: Eurocode uses a formula based on wood calorific values, while the US typically uses the 1500 constant from Kawagoe.
Spero che questa guida dettagliata sia utile per i tuoi calcoli di ingegneria della sicurezza antincendio.
Calculation example in both Methodologies
This guide provides a comprehensive comparison of the Heat Release Rate (HRR) curve calculation for a 100 m² office with five 2×1 m doors, following both the Eurocode (EN 1991-1-2) and the US (NFPA/SFPE) methodologies.
Common Scenario Parameters
- Compartment Area (\(A_f\)): \(100 \text{ m}^2\).
- Openings: 5 doors of \(2 \times 1 \text{ m}\) each.
- Total Opening Area (\(A_v\) or \(A_o\)): \(5 \times (2 \times 1) = 10 \text{ m}^2\).
- Weighted Opening Height (\(h_{eq}\) or \(H_o\)): \(2 \text{ m}\).
- Occupancy Type: Office (Medium fire growth).
Methodology 1: Eurocode (EN 1991-1-2 Annex E)
European designers rely on formalized tables and safety factors to determine the fire load and HRR limits.
Step A: Design Fire Load Density (\(q_{f,d}\))
The energy available depends on the occupancy risk. For an office, the characteristic fire load density (\(q_{f,k}\)) is \(511 \text{ MJ/m}^2\) (80% fractile). $$q_{f,d} = q_{f,k} \cdot m \cdot \delta_{q1} \cdot \delta_{q2} \cdot \delta_n \quad [MJ/m^2]$$ Assuming standard conditions where \(\delta\) factors ≈ 1.0 and combustion factor \(m = 0.8\) (cellulosic load): $$q_{f,d} = 511 \times 0.8 = 408.8 \text{ MJ/m}^2$$ Total Energy (\(E_{total}\)): \(408.8 \text{ MJ/m}^2 \times 100 \text{ m}^2 = 40,880 \text{ MJ}\).
Step B: Growth Phase
Offices are categorized as Medium growth. The time to reach 1 MW (\(t_\alpha\)) is \(300 \text{ s}\). $$\dot{Q}(t) = 1000 \cdot \left( \frac{t}{300} \right)^2 \quad [kW]$$
Step C: Peak Heat Release Rate (\(\dot{Q}_{max}\))
Eurocode considers the lower of two limits:
- Fuel-Controlled: \(\dot{Q}_{max, f} = RHR_f \cdot A_f\). For offices, \(RHR_f = 250 \text{ kW/m}^2\). $$\dot{Q}_{max, f} = 250 \times 100 = 25,000 \text{ kW} (25 \text{ MW})$$
- Ventilation-Controlled: \(\dot{Q}_{max, v} = 0.10 \cdot m \cdot H_u \cdot A_v \cdot \sqrt{h_{eq}}\). With \(H_u = 17.5 \text{ MJ/kg}\) (wood) and \(m = 0.8\): $$\dot{Q}_{max, v} = 0.10 \times 0.8 \times 17.5 \times 10 \times \sqrt{2} = 19.8 \text{ MW}$$ Selected \(\dot{Q}_{max}\): The fire is ventilation-limited at 19.8 MW.
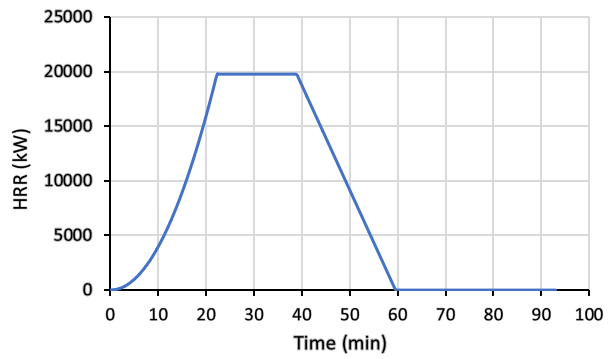
Step D: Phase Durations
- Time to Peak (\(t_{max}\)): \(\sqrt{19800 \cdot 300^2 / 1000} = 1334 \text{ s}\).
- Energy in Growth: \(E_{growth} = \frac{1}{3} \cdot 19800 \cdot 1334 / 1000 = 8804 \text{ MJ}\).
- Decay Start (\(t_{decay}\)): Starts when 70% of energy is consumed (\(0.7 \times 40880 = 28616 \text{ MJ}\)). $$t_{decay} = 1334 + \frac{28616 – 8804}{19.8 \times 10^3 / 10^3} = 2335 \text{ s}$$
- Total Duration (\(t_{tot}\)): Linear decay of remaining 30%. $$t_{tot} = 2335 + \frac{2 \cdot 0.3 \cdot 40880}{19800} = 3574 \text{ s}$$
Methodology 2: US Approach (NFPA 92 / SFPE)
US designers often select HRRPUA based on specific experimental data rather than fixed tables, and use Kawagoe’s Law for ventilation.
Step A: Input Selection (HRRPUA and Energy)
A US designer would look at the SFPE Handbook or Law’s research, recommending an HRRPUA of \(290 \text{ kW/m}^2\) for office furniture. The fire load density for offices is often taken as an average of \(420 \text{ MJ/m}^2\). Total Energy (\(E_{total}\)): \(420 \text{ MJ/m}^2 \times 100 \text{ m}^2 = 42,000 \text{ MJ}\).
Step B: Growth Phase
Using the \(t^2\) fire growth coefficient \(\alpha = 0.0117 \text{ kW/s}^2\) for Medium growth. $$\dot{Q} = 0.0117 \cdot t^2 \quad [kW]$$
Step C: Peak Heat Release Rate (\(\dot{Q}_{peak}\))
- Fuel-Controlled: \(\dot{Q}_{peak, f} = \dot{q}” \cdot A_{fire}\). $$\dot{Q}_{peak, f} = 290 \times 100 = 29,000 \text{ kW} (29 \text{ MW})$$
- Ventilation-Controlled (Kawagoe’s Law): \(\dot{Q}_{max, v} = 1500 \cdot A_o \cdot \sqrt{H_o}\). $$\dot{Q}_{max, v} = 1500 \times 10 \times \sqrt{2} = 21,213 \text{ kW} \approx 21.2 \text{ MW}$$ Selected \(\dot{Q}_{peak}\): The fire is ventilation-limited at 21.2 MW.
Step D: Phase Durations (Energy Conservation Method)
- Time to Peak (\(t_{peak}\)): \(\sqrt{21213 / 0.0117} = 1346 \text{ s}\).
- Growth Energy: \(E_{growth} = \frac{1}{3} \cdot 21213 \cdot 1346 / 1000 = 9518 \text{ MJ}\).
- Steady State Duration (\(t_{steady}\)): Using the 70% threshold (TER = 42000 MJ). $$t_{steady} = \frac{(0.7 \cdot 42000) – 9518}{21.2 \times 10^3 / 10^3} = 938 \text{ s}$$
- Decay Phase (\(t_{decay}\)): Linear ramp using the remaining 30% (12,600 MJ). $$t_{tot} = (1346 + 938) + \frac{2 \cdot 12600}{21213} = 3472 \text{ s}$$
Comparative Summary of Input Choices
| Parameter | Eurocode Choice (EU) | US/NFPA Choice (US) | Reasoning/Source |
|---|---|---|---|
| Fuel Power | \(250 \text{ kW/m}^2\) | \(290 \text{ kW/m}^2\) | EU uses standardized Annex E tables; US uses historical averages from Law/Theobald experiments. |
| Fire Load | \(511 \text{ MJ/m}^2\) | \(420 \text{ MJ/m}^2\) | EU uses 80% fractile for safety; US often uses mean values from specific surveys. |
| Growth Rate | \(t_\alpha = 300 \text{ s}\) | \(\alpha = 0.0117\) | Mathematically identical definitions for “Medium” growth. |
| Ventilation | \(19.8 \text{ MW}\) | \(21.2 \text{ MW}\) | EU formula accounts for the specific chemistry of wood (\(H_u = 17.5\)); US uses a generic 1500 constant assuming 3.0 MJ/kg of air. |
Conclusion: Both methods yield a ventilation-controlled fire. However, the US method predicts a slightly higher peak (21.2 MW vs 19.8 MW) because the Kawagoe constant is less conservative than the specific wood-calorific calculation in the Eurocode. The EU method results in a longer total duration (3574 s vs 3472 s) due to its higher characteristic fire load density choice (\(511\) vs \(420 \text{ MJ/m}^2\)).
FDS Implementation Strategies
- RAMP Function: Manually input the curve using multiple &RAMP lines.
- SPREAD_RATE: Set a radial spread rate to match \(\alpha\):
\(v_{spread} = \sqrt{\frac{\alpha}{\pi \cdot \text{HRRPUA}}}\)