
An A/B simulation that separates the compartment response from fuel suppression
Table of Contents
Abstract
In a fire simulation, the heat-release-rate (HRR) curve can be specified by the user or emerge from a model of the burning material. That distinction matters when a sprinkler operates. Water can cool the gas and alter smoke movement, but a prescribed fuel source does not automatically produce less fuel simply because it is wetted.
We compared two Fire Dynamics Simulator (FDS) cases in the same 4 × 4 × 3 m compartment. Case A has a 1 m² burner ramping up to a nominal 500 kW over 10 s. Case B adds a thermally activated sprinkler. In the 30 s runs with 0.05 m cubic cells, the sprinkler activates at 11.225 s. From 13.225 to 30 s, the mean temperature of a fixed upper measurement region is about 33 °C lower in B, while the domain-integrated HRR fluctuates around 500 kW in both cases. Water-vapour concentration rises. A visibility estimate at one point near the doorway shows no clear improvement.
The interpretation is specific to these inputs: FDS calculates the gas and spray response, but this model contains no mechanism linking water to a reduction in fuel supply. FDS also offers pyrolysis models and an empirical suppression option for prescribed-HRR surfaces; neither is used here. This is a diagnostic study of model behaviour, not an experimental validation of a sprinkler.
1. The physical question
Heat release rate, or HRR, is the rate at which a fire releases energy, expressed here in kilowatts. In a real fire involving a solid material, flames heat the surface, the surface produces combustible gases through pyrolysis, and those gases feed the flames. Water may remove heat from the surface, change its gas-production rate and, under some conditions, reduce HRR.
A burner specified with HRRPUA works differently. FDS uses the prescribed heat-release rate per unit area to set an equivalent gaseous-fuel flux. This representation is useful when the fire scenario is already known and the objective is to study the compartment. By itself, however, it does not describe an object that heats up, becomes wet and changes its pyrolysis rate. The FDS User’s Guide, §§9.1–9.2 describes an HRRPUA source as a burner with a specified fuel flux.
Our question is therefore narrow: what changes does the spray produce in the compartment when the fuel source remains prescribed? We do not ask these two runs to predict extinction of a real fuel package.
2. The A/B model
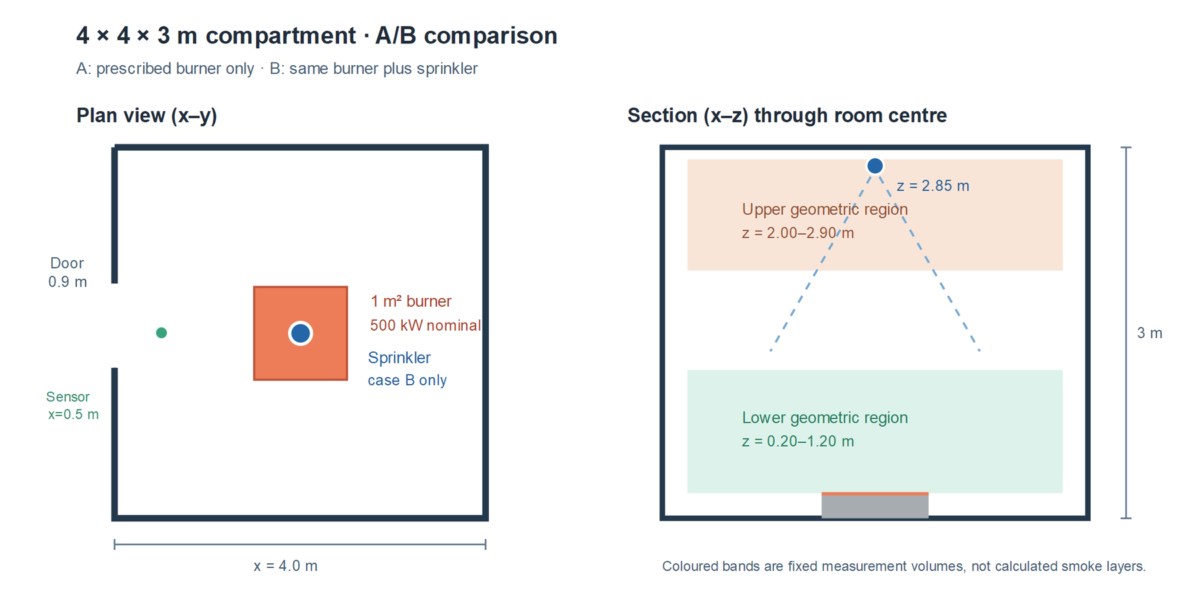
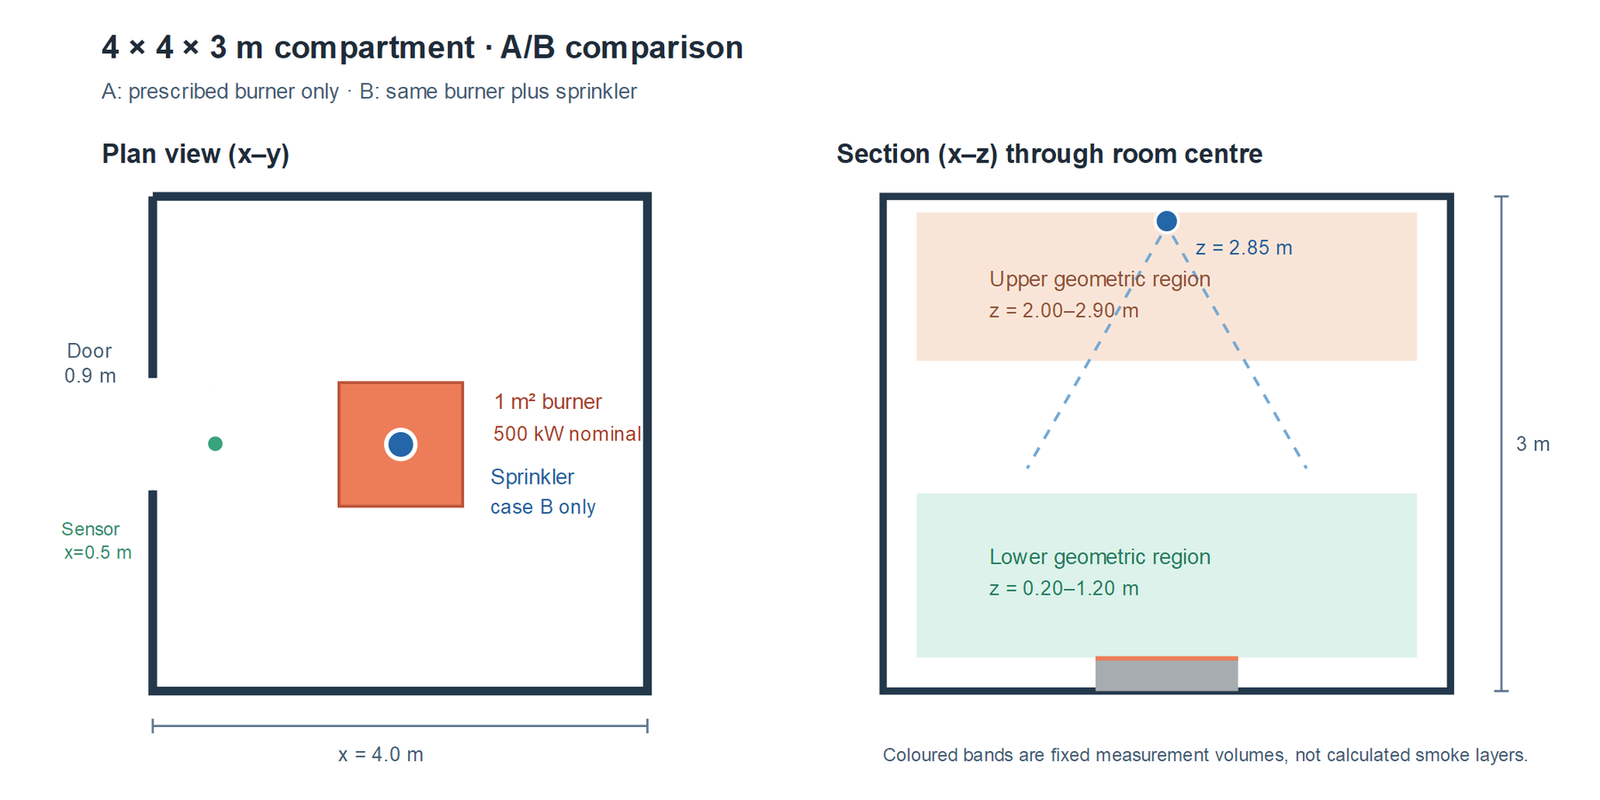
Figure 1 shows the geometry and measurement regions. The doorway is the only opening and is located on a domain boundary. The sensor called “near the exit” is actually inside the room, 0.5 m from the wall containing the doorway. It does not directly measure conditions across the threshold.
| Item | FDS input |
|---|---|
| Domain | 4.0 × 4.0 × 3.0 m |
| Open doorway | 0.90 × 2.10 m, on the XMIN wall |
| Burner | 1.0 m² on top of a 0.20 m-high base |
| Source | HRRPUA=500 kW/m², linear ramp from 0 to 10 s; nominal total 500 kW |
| Gaseous fuel | Propane; SOOT_YIELD=0.01 |
| Walls and base | Default FDS thermal boundary conditions; no MATL properties assigned |
| Case B | One sprinkler at (2.00, 2.00, 2.85) m |
| Duration | 30 s on the 0.05 m mesh; 22 s in the preliminary meshes |
The absence of MATL properties on the walls is an important simplification. According to the FDS User’s Guide, §8.1, solid boundaries and obstructions with no additional thermal properties are held at ambient temperature. These runs therefore do not represent the thermal inertia of real walls. Temperature predictions are affected by that choice, especially in a small compartment.
2.1 How the sprinkler is represented
In case B, the thermal link has a nominal activation temperature of 68 °C and RTI=50 (m·s)¹ᐟ². C_FACTOR is not specified and takes its default value of zero. After activation, the prescribed water flow is 80 L/min. Droplets have a single initial diameter of 1,000 µm (1 mm) and an initial speed of 5 m/s. SPRAY_ANGLE=45.,55. places them within an angular band from 45° to 55° relative to the downward vertical; it does not define a solid cone. The FDS User’s Guide, §18.3.1 defines these parameters and their units.
This is an idealised spray, not a measured characterisation of a commercial device. We do not describe it as water mist: a monodisperse population of 1 mm droplets does not justify that label. The actual droplet-size distribution, spatial discharge pattern and operating pressure have not been calibrated.
The sprinkler generates liquid particles that FDS transports and couples to the gas. The FDS Technical Reference Guide, §§9.4–9.5 describes the water-droplet evaporation and suppression models. The simulation can therefore produce gas cooling, evaporation and changes in flow. We have no validated measure of how much water reaches the burner, however, and no combustible surface whose pyrolysis responds to wetting. An AMPUA diagnostic is present in the B input, but it is not used to support our conclusions: interpreting it in this setup is sensitive to how the surface aligns with the mesh.
2.2 Mesh and resolution
We ran A and B on three meshes:
| Mesh | Cells | Cell dimensions | Duration |
|---|---|---|---|
| 0.10 m | 40 × 40 × 30 | 0.10 × 0.10 × 0.10 m | 22 s |
| Intermediate | 50 × 50 × 40 | 0.08 × 0.08 × 0.075 m | 22 s |
| 0.05 m | 80 × 80 × 60 | 0.05 × 0.05 × 0.05 m | 30 s |
For a nominal 500 kW fire under standard ambient conditions, the characteristic fire diameter is approximately D* ≈ 0.73 m. Thus D*/Δx ≈ 7.3 on the 0.10 m mesh and ≈ 14.5 on the 0.05 m mesh. This is a useful measure of plume resolution, not a universal accuracy threshold.
The intermediate mesh is nearly isotropic, but it is not an exact halving of the coarse cells. The comparisons below focus on the two cubic-cell meshes. Mesh comparisons end at 22 s, when the coarse runs end; we do not compare the fine-mesh interval from 22 to 30 s with a nonexistent coarse-mesh result.
3. How the outputs are interpreted
HRR in the *_hrr.csv file is the calculated combustion power integrated over the domain. By contrast, HRRPUA=500 kW/m² specifies the nominal fuel supply on the 1 m² burner surface. The two quantities need not match at every instant: gas-phase combustion and numerical transport introduce fluctuations. A change in reported HRR alone does not show that the surface has produced less fuel.
T_UPPER_MEAN and T_LOW_MEAN are spatial averages over fixed volumes: z=2.00–2.90 m and z=0.20–1.20 m, respectively, with x,y=0.25–3.75 m. We call these the upper geometric region and lower geometric region. We did not calculate a moving smoke-layer interface, so these averages should not be presented as temperatures of a time-varying physical upper layer.
H2O_UPPER_MEAN is the mean water-vapour mass fraction in the upper geometric region. VIS_EXIT_1P8 is a visibility estimate at one point, (0.50, 2.00, 1.80) m. With the simplified chemistry used here, FDS relates VISIBILITY to smoke concentration and extinction coefficient; in simplified form, S=C/K. Our inputs set SOOT_YIELD=0.01 but do not customise C or the mass extinction coefficient, so FDS uses its defaults. The reported visibility is capped at 30 m. A point sensor is not the same as visibility along an evacuation route, nor does it fully assess the optical effect of water droplets.
The main results use 13.225–30 s: the window begins two seconds after the sprinkler activates in the fine-mesh B run (11.225 s) and is common to both fine-mesh cases. The table below reports arithmetic means of CSV samples in that window, as calculated by the analysis script. The two-second delay is an operational choice to reduce the immediate spray-start transient, not a measured physical threshold. This is roughly 17 seconds of early response, not a demonstrated steady state.
4. Results on the 0.05 m mesh
| Quantity, 13.225–30 s | Case A: no sprinkler | Case B: sprinkler | Difference B − A |
|---|---|---|---|
| Mean domain HRR [kW] | 500.4 | 499.3 | −1.1 |
| Mean upper-region temperature [°C] | 179.3 | 146.0 | −33.3 |
| Mean lower-region temperature [°C] | 71.0 | 67.5 | −3.5 |
| Mean upper-region H₂O mass fraction [–] | 0.01539 | 0.02597 | +0.01058 |
| Mean visibility at indoor sensor, z=1.8 m [m] | 9.88 | 9.97 | +0.09 |
The small difference in mean HRR is smaller than the fluctuations in the time series. The table does not show a sustained reduction in combustion power. The decrease in upper-region temperature, by contrast, is substantial in this model and over this window. The lower-region means differ much less. Water vapour increases after the spray is introduced.
4.1 Heat release: prescribed source versus calculated HRR
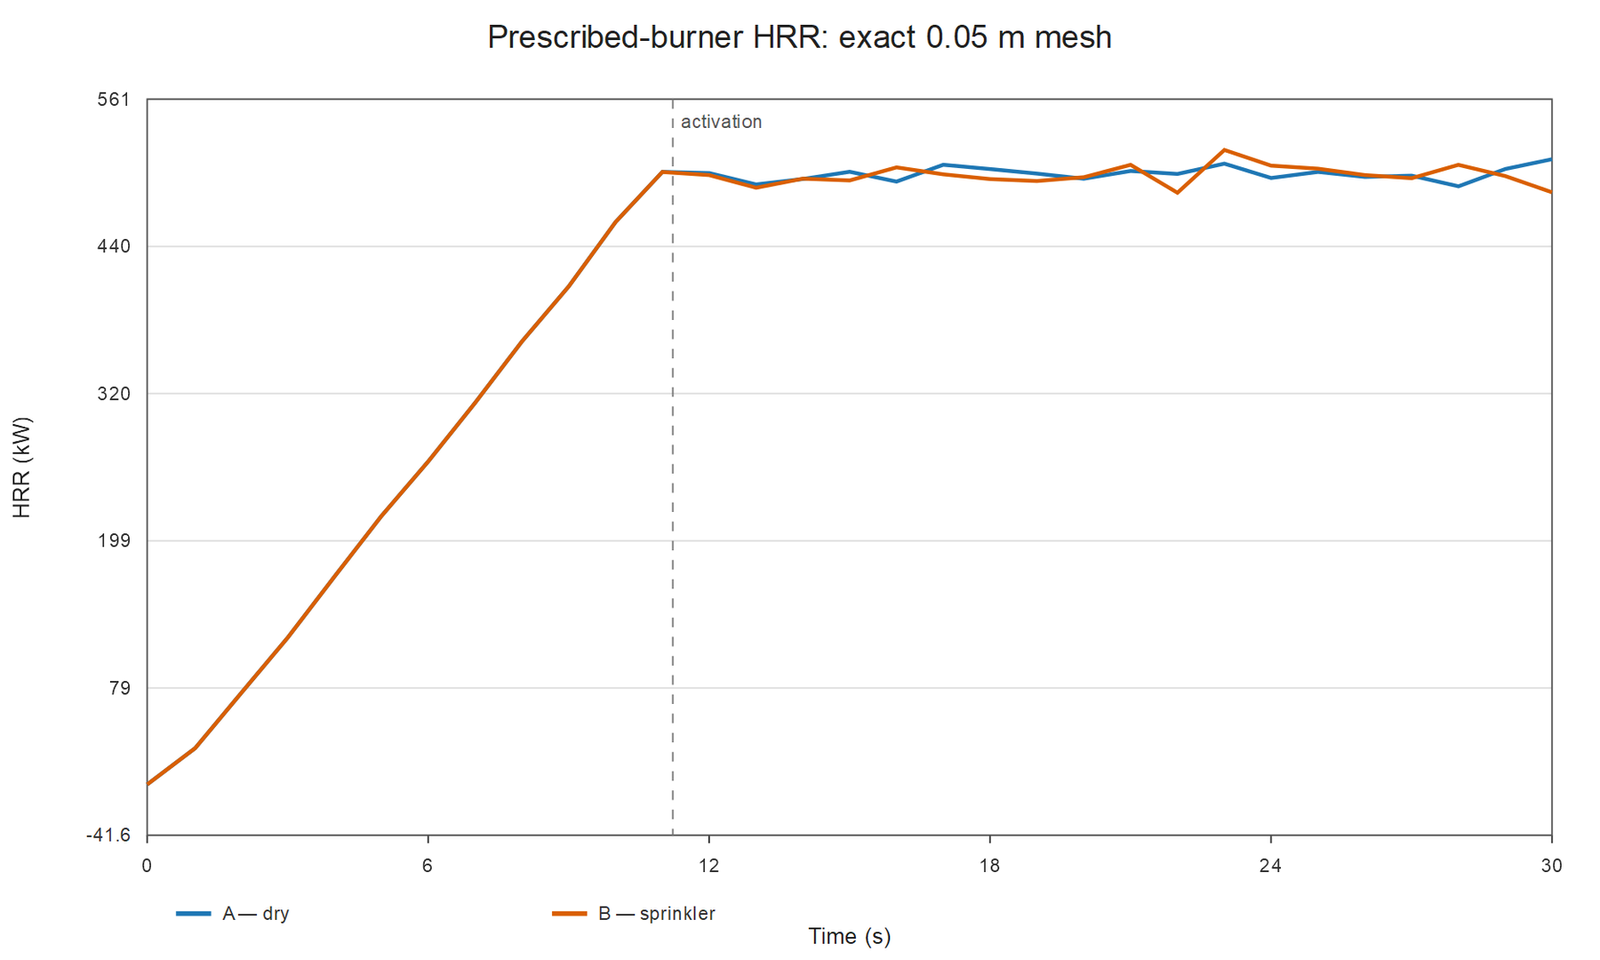
Integrated HRR varies in both cases. B’s final sample is approximately 485 kW, but one low sample is not evidence of suppression. Its mean over the post-activation window remains about 499 kW, and the prescribed source continues to supply fuel. More generally, if a gas-phase extinction model reduced local combustion, calculated HRR could change even with a prescribed fuel flux. That would not, by itself, demonstrate reduced pyrolysis of a solid.
4.2 Thermal response in two regions
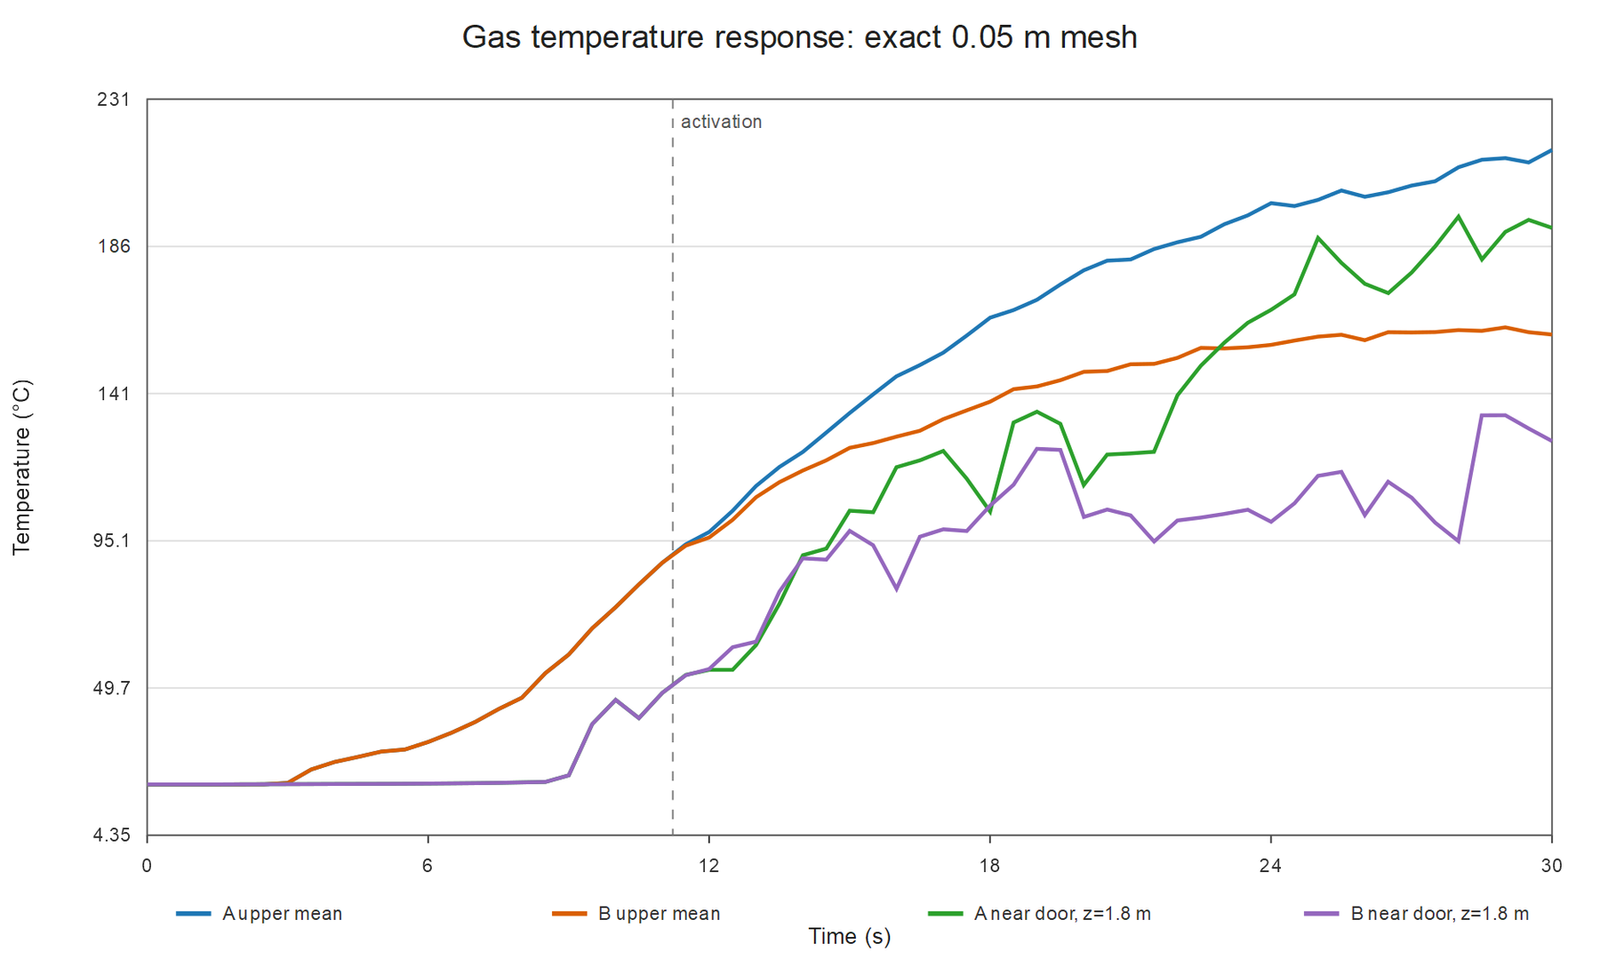
Over the selected window, the upper geometric region in B is cooler by 33.3 °C on average. The difference between lower-region means is 3.5 °C. These quantities describe the resulting thermal field as the spray interacts with hot gas, ventilation through the doorway and thermal boundaries. They do not apportion the cooling among evaporation, flow entrainment and radiative effects; that would require additional energy balances and sensitivity tests.
4.3 Water vapour
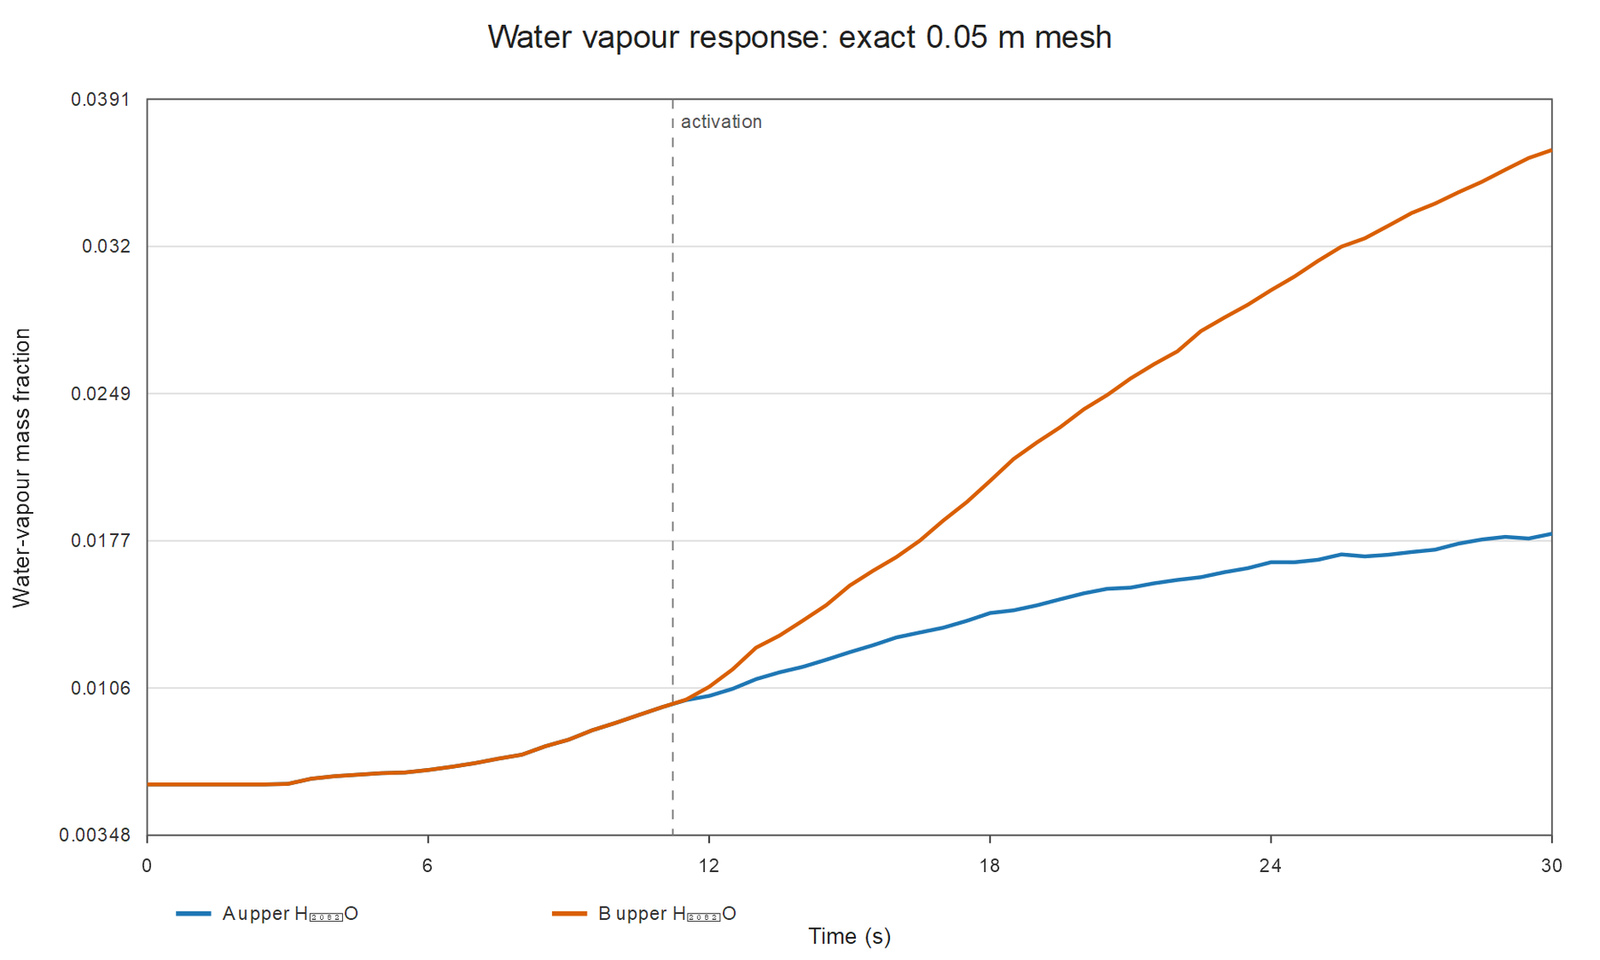
The mean rises from 0.01539 to 0.02597. This increase is consistent with droplet evaporation in the calculation. It does not, on its own, measure sprinkler effectiveness or the amount of water deposited on the burner.
4.4 Visibility: a local signal, not a general conclusion
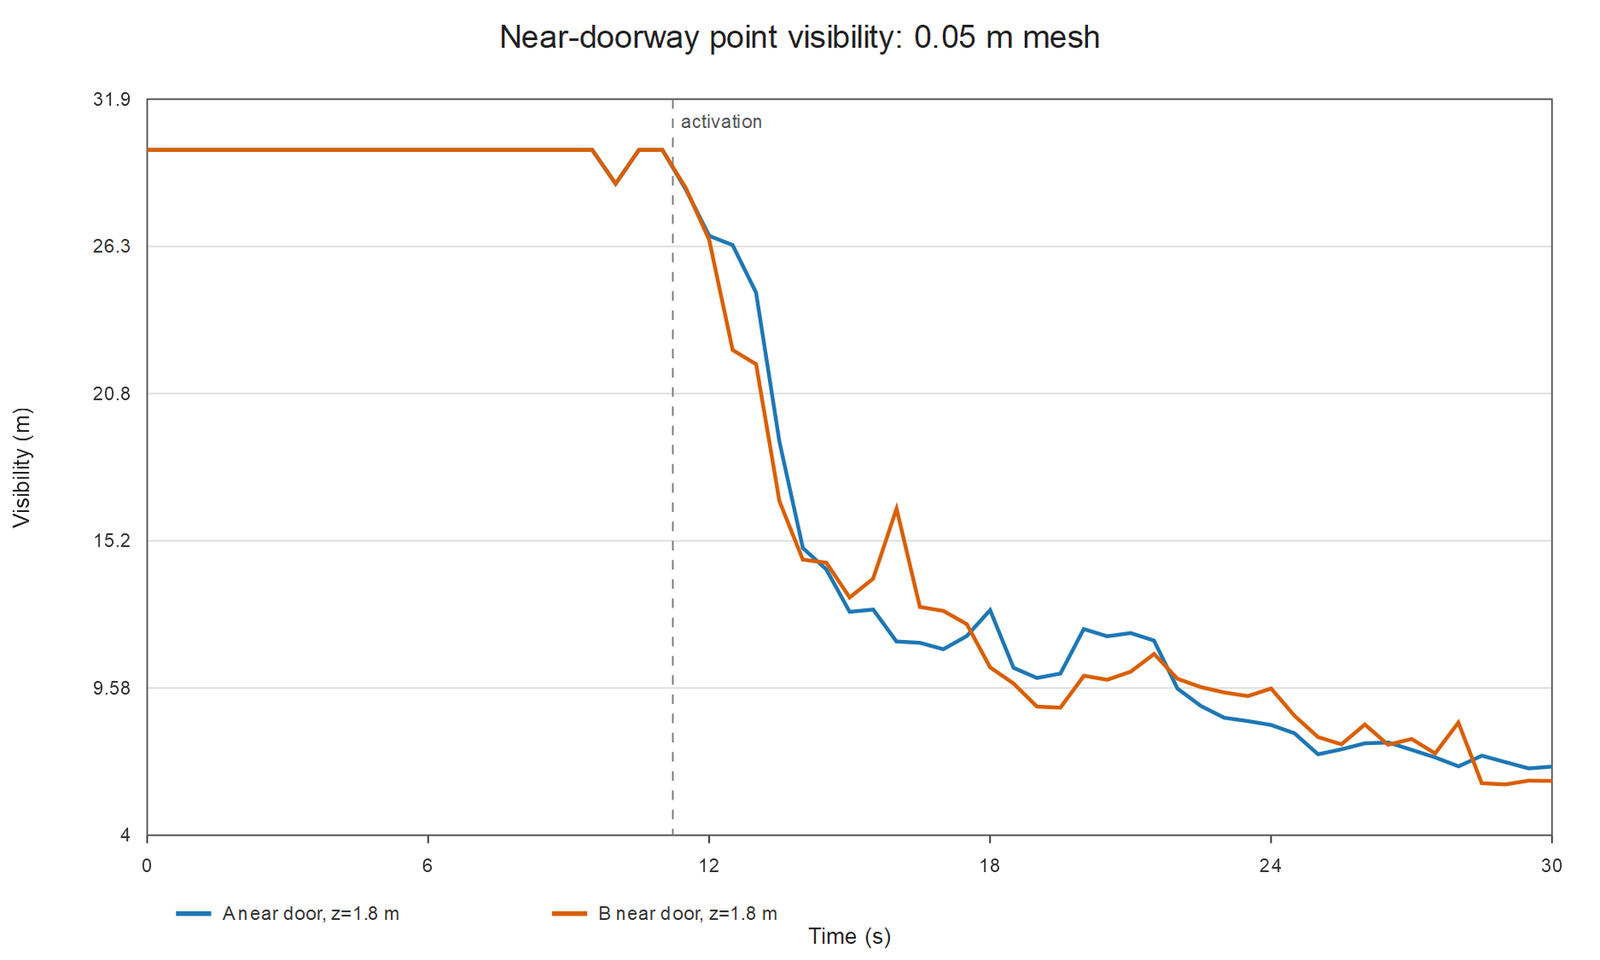
(0.50, 2.00, 1.80) m. These are point time series, not path-integrated visibility along an evacuation route.The sample means over the same window are almost identical: 9.88 m in A and 9.97 m in B. Their minima are 6.53 and 5.93 m, but these occur at different times; subtracting the minima does not measure the sprinkler’s effect at a given instant. These data do not support a general claim of improved or worsened visibility. More locations, a path-based assessment and experimental data would be needed, particularly if droplet optics are part of the question.
5. How sensitive are the results to the mesh?
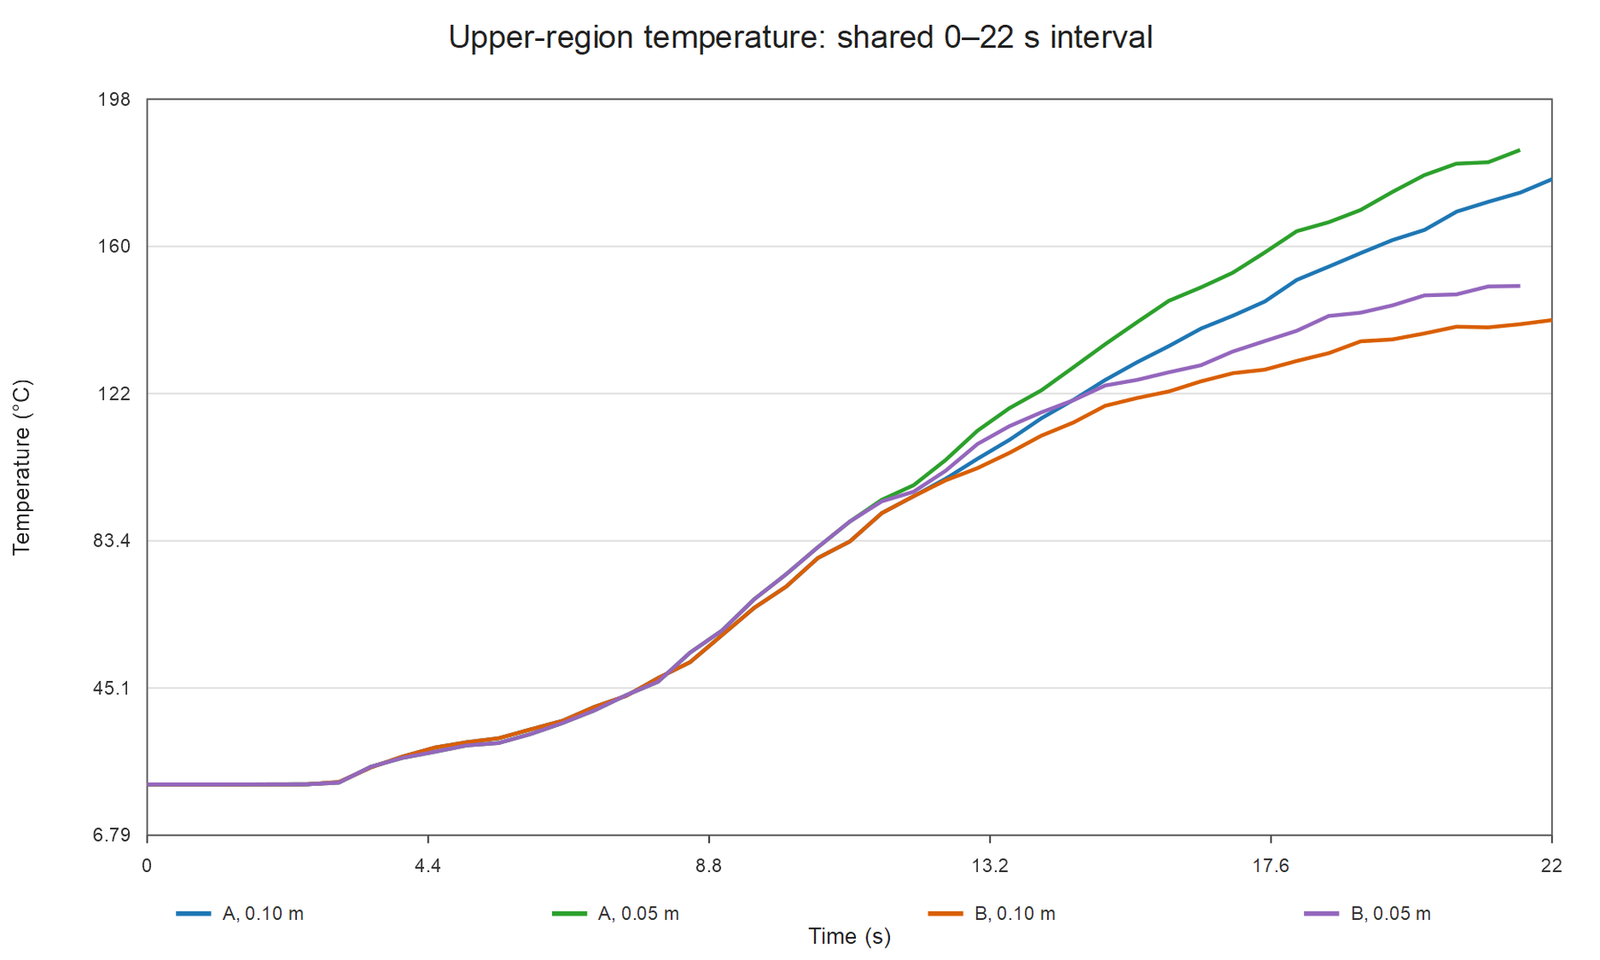
The calculated sprinkler activation time changes with discretisation:
| Mesh | Calculated activation time |
|---|---|
| 0.10 m | 12.174 s |
| 0.08 × 0.08 × 0.075 m | 11.110 s |
| 0.05 m | 11.225 s |
To compare temperatures, we use a second common window, 13.225–22 s, and integrate the time series with linear interpolation at the window endpoints. The result indicates numerical sensitivity; it is not proof of convergence:
| Mesh | A: upper region [°C] | B: upper region [°C] | B − A [°C] |
|---|---|---|---|
| 0.10 m | 145.8 | 127.4 | −18.4 |
| 0.05 m | 156.7 | 134.8 | −21.9 |
The qualitative thermal response is similar, but both the values and activation times change. Two meshes cannot establish that the 0.05 m result is “converged.” These are also single, deterministic runs; they do not quantify variability associated with turbulent fluctuations or particle sampling. A stricter convergence study would repeat runs at more resolutions and equal durations.
6. What would it take to study fuel suppression?
Our burner input includes HRRPUA and RAMP_Q; it includes neither E_COEFFICIENT nor a solid fuel defined with MATL. Thus the model has no explicit link between water collected on the burner surface and a reduction in fuel supply.
FDS offers more options than this experiment exercises. The FDS User’s Guide, §15.7.2 describes E_COEFFICIENT, an empirical coefficient that can reduce the burning rate of an HRRPUA surface as a function of local water application. That coefficient requires experimental data: choosing one arbitrarily might produce a declining fire curve, but would not validate it. The guide also describes the MATL route, in which surface cooling may change calculated pyrolysis. A credible prediction for a real material would require fuel characterisation, a defensible description of the water reaching it, and comparison with independent tests.
Manually cutting an HRR curve when the sprinkler activates can also serve a legitimate purpose: defining a hypothetical controlled-fire scenario. In that case, the origin of the post-activation curve and the real situations it represents should be stated. It should not be presented as a quantity predicted by the A/B runs reported here.
The distinction helps frame the engineering question. If the objective is to evaluate temperatures under a specified design fire, a prescribed HRR may be appropriate. If the objective is to predict how much a sprinkler reduces fuel production, a suitable suppression model and data to calibrate and test it are needed.
7. Limitations
The numerical results apply to a small compartment with one open doorway, walls held at ambient temperature, propane with SOOT_YIELD=0.01, an idealised monodisperse spray and a 30 s horizon. The 146 °C upper-region temperature in B is not transferable to a real room with different walls, fire load and sprinkler. The post-activation window captures early evolution; it does not establish steady state or rule out subsequent regrowth.
The runs used FDS 6.10.1.
8. Conclusion
In this A/B comparison, adding the spray is associated with a lower mean upper-region temperature and a higher water-vapour mass fraction. Domain-integrated HRR remains close to its nominal 500 kW level on average, and the inputs contain no model by which applied water reduces fuel supply. The experiment therefore illustrates the modelled compartment response around a prescribed source, not the extinction of a real material.
A useful next study should begin with a documented fire test: known fuel, defined geometry and ventilation, measured sprinkler flow and spray distribution, and HRR recorded before and after activation. Only then could we test whether a fuel-and-suppression model reproduces the observed HRR decline as well as the gas response.
Technical references
- McGrattan, K., McDermott, R., Vanella, M., Mueller, E., Hostikka, S., Floyd, J. and Paul, C. Fire Dynamics Simulator User’s Guide. NIST Special Publication 1019, sixth edition, revision for FDS 6.11.1, 10 July 2026. doi:10.6028/NIST.SP.1019. Sections used: 6.3.6 (mesh), 8.1 (solid boundaries), 9.1–9.2 (prescribed HRR), 15.7.2 (burning-rate reduction), 18.3.1 (sprinklers), and 22.10.5 (visibility).
- McGrattan, K. et al. Fire Dynamics Simulator Technical Reference Guide, Volume 1: Mathematical Model. NIST Special Publication 1018-1, local edition dated 10 July 2026. doi:10.6028/NIST.SP.1018. Sections consulted: 9.4–9.5 (droplet evaporation and water suppression).